Proposed Metrics for Equitable and Expanded Opportunity in the Economic Recovery
MEMORANDUM
DATE: July 17, 2009
FROM: The Opportunity Agenda, NAACP Legal Defense Fund, The Center for Social Inclusion, and Leadership Conference on Civil Rights
RE: Proposed Metrics for Equitable and Expanded Opportunity in the Economic Recovery
This memorandum outlines a proposal from The Opportunity Agenda, NAACP Legal Defense Fund, The Center for Social Inclusion, and Leadership Conference for Civil Rights for measuring equity throughout the ongoing economic recovery process.
Ensuring that the American Recovery and Reinvestment Act (ARRA or the Act) meets its goals requires transparency and accountability with regard to equity and equal opportunity. Only by using performance metrics that look beyond simply whether money is being spent and toward whether the funds are expanding opportunity and working in a transformative manner can these goals be satisfied. For example, one important goal of the Act is to support long-term infrastructure for a new economy. Simply returning to the state of the country in 2007 before the worst of the economic downturn began will not build a 21st century economy. Ensuring that the recovery is fair, equal, and equitable is crucial to creating quality jobs and careers, sustainable industries, and housing and transportation that fulfills unmet needs and build paths of mobility for all Americans.
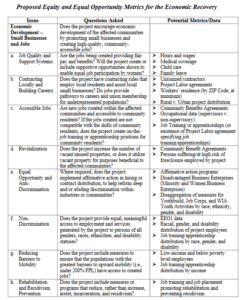
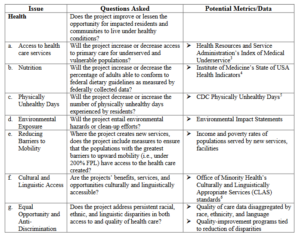
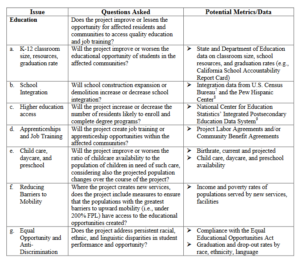
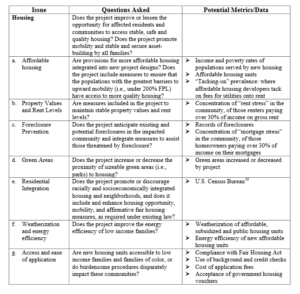
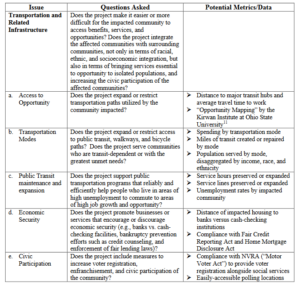
The data necessary to measure equity and the expansion of opportunity in a specific project will frequently be available from existing sources. After identifying the relevant geographic area, agencies can draw first from existing federal, state, and municipal data, including Census data, to determine likely impact.1 Important equity issues, the relevant questions that agencies should be asking about how ARRA projects impact those issues, and potential metrics and data sources to answer those questions are suggested below for five areas: 1) Economic Development (including any job creation across all sectors); 2) Health; 3) Education; 4) Housing; and 5) Transportation and Related Infrastructure.2
Notes:
1. Federal data that demonstrates access to opportunity is available on a wide range of issues. See The Opportunity Agenda, The State of Opportunity 2009.
2. Some questions and potential metrics are informed in part by a day-long meeting on June 19, 2009 co-hosted by Center for American Progress, The Center for Social Inclusion, Economic Policy Institute, Good Jobs First, Institute for Policy Studies, Jobs With Justice, OMB Watch, and OpenTheGovernment.org. The meeting, “Promoting Equity Metrics in the Recovery Act,” brought together groups from across the country working toward a fair and equitable recovery.
3. Health Resources & Servs. Admin., U.S. Dep’t of Health & Human Servs., HPSA Designation.
4. Institute of Medicine, State of U.S.A. Health Indicators.
5. Ctrs. for Disease Control & Prevention, Health-Related Quality of Life – Prevalence Data, Mean Physically Unhealthy Days.
6. Office of Minority Health, U.S. Dep’t of Health & Human Servs., National Standards.
7. U.S. Census Bureau, Housing Patterns..
8. Pew Hispanic Center, Racial and Ethnic Composition of Schools, August 30, 2007, Table 1.
9. Nat’l Ctr. for Educ. Statistics, U.S. Dep’t of Education, Integrated Postsecondary Education Data System.
10. U.S. Census Bureau, Housing Patterns, supra note 23.
11. Opportunity Mapping, Kirwan Institute, Ohio State University.
