Breaking Down Portrayed Income
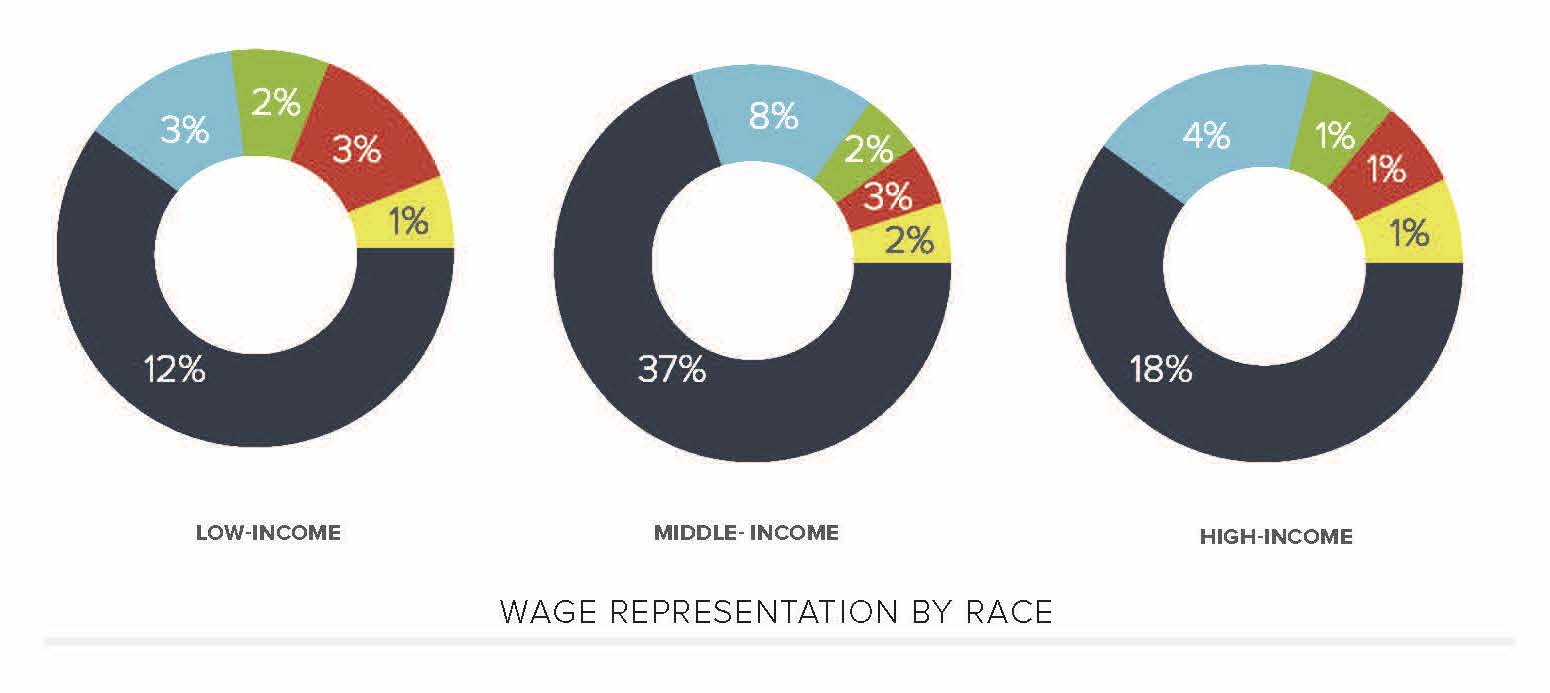
In the 2017–2018 season of television, character representation across race and ethnicity skews overwhelmingly white. This disproportionate sample means that each level of income holds double-digit percentage rates of white representation, whereas their BIPOC peers remain 8% or less in any income representation. The greatest distribution of income representation by race/ethnicity occurs at the middle-income tier—with white characters making up 37%, Black characters 8%, Hispanic 3%, and Asian and Other at 2% each. This is unsurprising, given the wide range of income this designation covers.
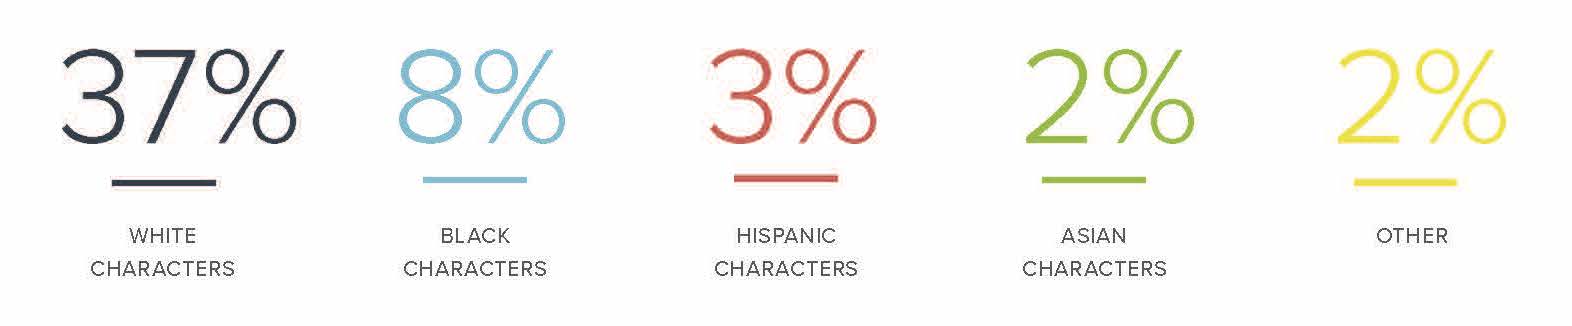
The overwhelming whiteness of the 2017–2018 TV season means that all calculations of race and income for this study are more likely to represent white characters and households. White characters out-ratio Black characters such that we see 4 white characters for every 1 Black character, 11 white characters to every Hispanic character, 13 white characters to every 1 Asian character, and 14 white characters to every character included in the “Other” category—which typically identifies persons of mixed ethnicity or race. There is, in fact, no representation at all in the entire sample of Native/Indigenous characters, an extremely excessive oversight on behalf of casting in Hollywood.
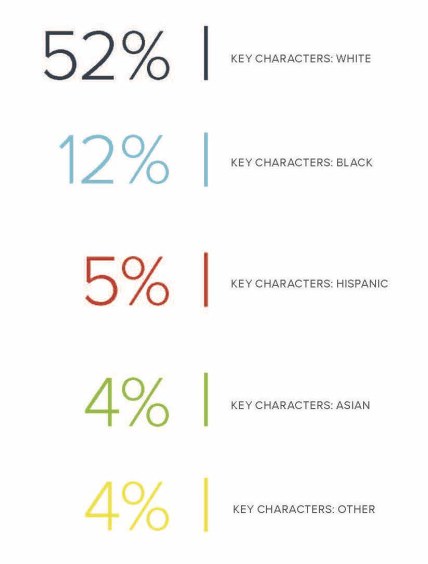
Approximately 75% of all characters included in this sample were part of the main cast of their respective shows, while 23% of the sample filled either recurring or guest spots. Much of the same race/ethnicity breakdowns remain the same in this breakdown, with 52% of key characters being white to 15% recurring, 12% key Black characters to 4% recurring, 5% key Hispanic characters to 1% recurring, 4% key Asian characters to 1% recurring, and equal amounts of characters representing key and recurring roles for those categorized as Other at 4% each. Here the overrepresentation of white characters stands without overrepresentation of any other race in either key or recurring roles. As far as income, key characters represent 18% of low-income characters to recurring characters’ 3%, 39% of middle-income characters to 13%, and 17% of low-income characters to 6% of high-income characters. To better encapsulate the circumstances these characters represented, we conducted an analysis of characters representing recurrent or low wage–bearing professions by their local or regional wage representation via Glassdoor. This includes common roles that place characters within the upper-middle income range of pay—such as investigators and detectives—as well as families of three or more living on lower middle to low incomes.
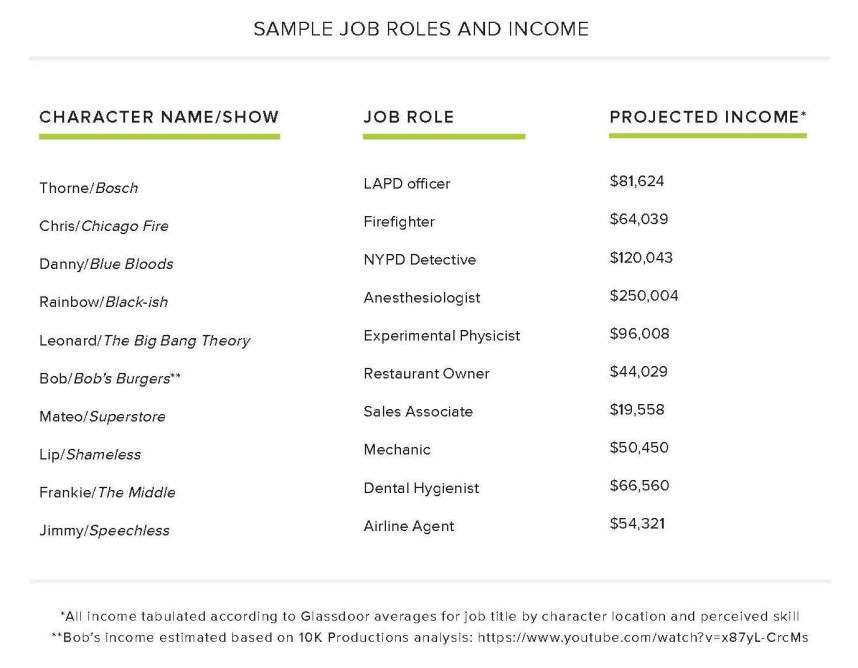
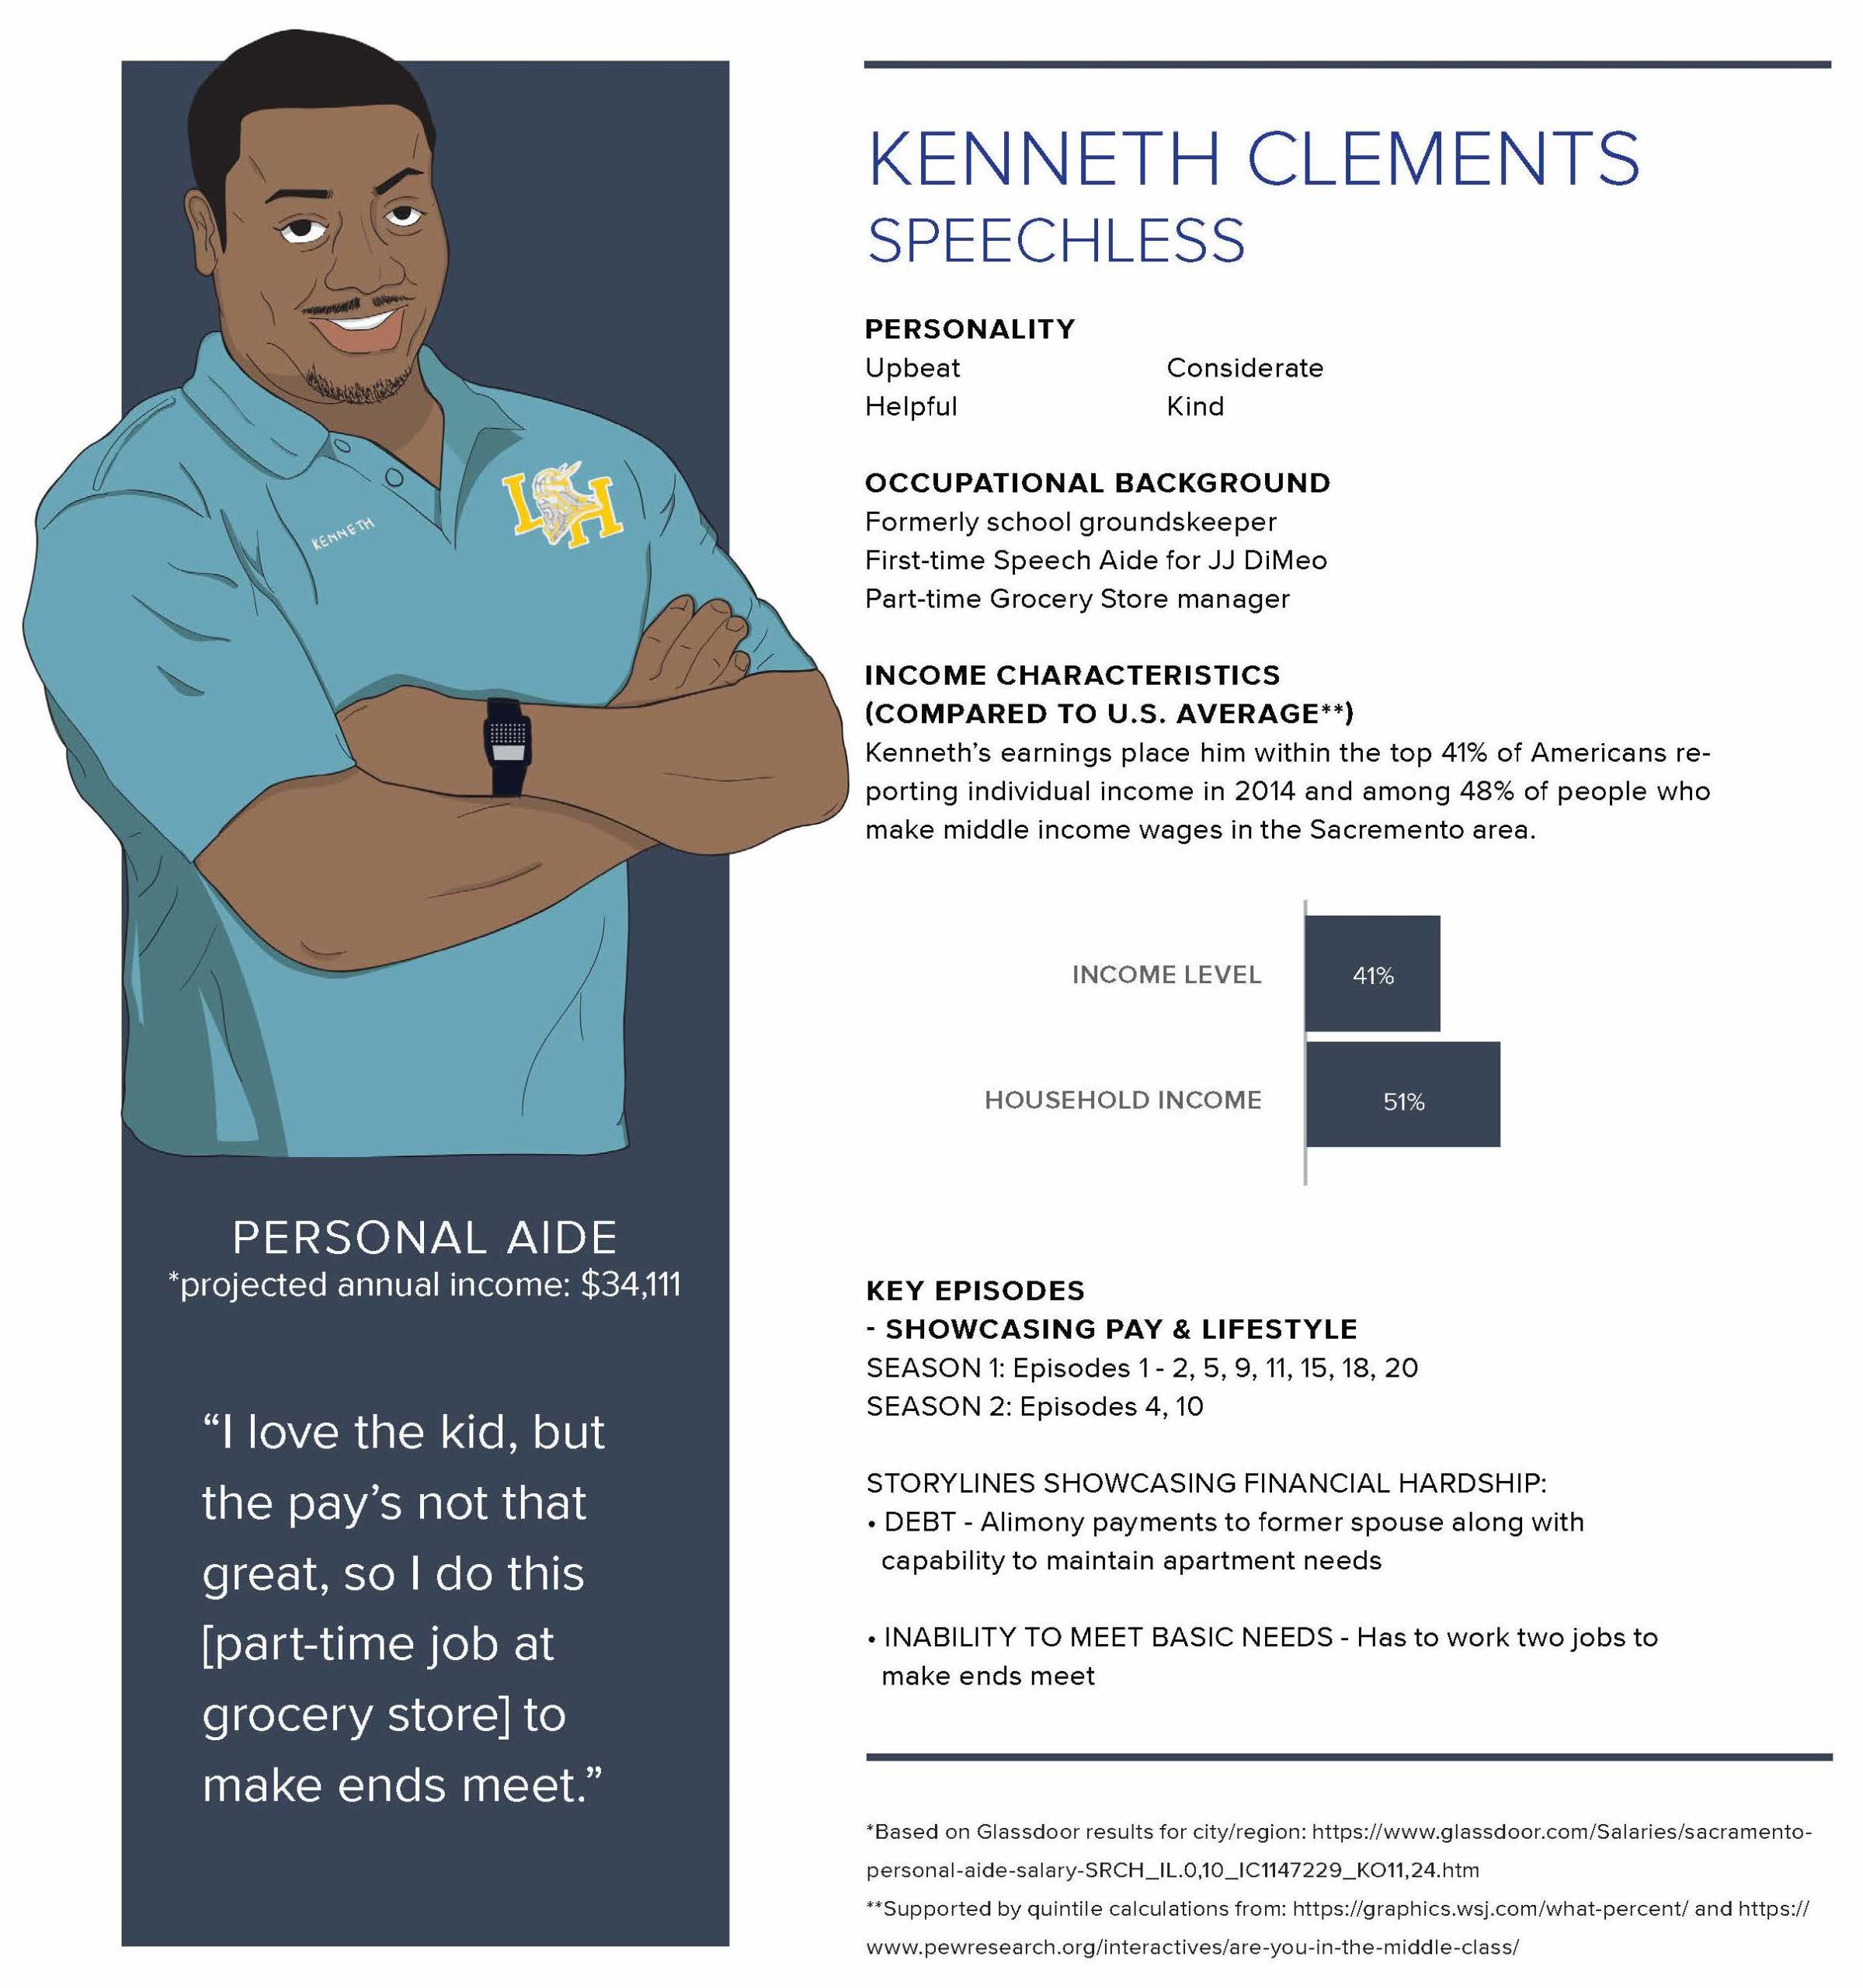
The spread of income presented in the table must be further scrutinized by the number of people in each household who also generate income as well as cost of living per locality. What we overwhelmingly found is that those with higher salaries tended to live in households with partners who generate similar income or on their own, leaving them free to afford cost of living in the cities they inhabit. For example, Rainbow Johnson from Black-ish not only generates high income as a physician, but she also is also married to a senior advertisement executive who helps their family of five children, two retired grandparents, and two working adults to pay for college, private school, and a lifestyle befitting the suburbs of Los Angeles. This representation is in direct juxtaposition to the DiMeo family in Speechless, who get by on the single income of the father, Jimmy DiMeo, and any disability aid that supports one of the three kids, JJ, who has cerebral palsy.
This is significant not only for offering a snapshot of the general spread of income representation and why outliers like the Johnson family influence the sample’s observed income by race, but also because studies indicate that many lower-middle to low-income families are simply one economic emergency away from being impoverished—with 45% of families having resources no more than twice the poverty threshold.[20]

Indeed, observations from hunger experts like Josh Gwin of Marion Polk Food Share shows that people who are only one missed utility bill away from hunger or eviction often depend on social services like food drives,[21] which bears questioning of the ways income have been calculated by scholar and the general public alike given inflation, stagnant wages, and increases to the cost of living throughout the United States. If someone who is considered middle income by current estimates is only one debt away from facing denial of food or shelter, is the income bracket underestimating poverty?
In terms of this report’s sample, while we found the levels of income tied to racial representation as a whole, we would like to note that the only key BIPOC character of The Big Bang Theory, Raj Koothrappali, works in a field that pays significantly less than his fellow scientists, at $60,056 to his peers’ income upwards of $90,000. While he is shown to be supported by his parents, who bring in significant wealth, this was an observance of significant difference by race within one show included in the sample.
While the above observations sum up the report sample, they do not represent the reality or scope of racial disparity in economic opportunities. In a 2021 Urban Institute report, two-thirds of white children were estimated to be born into advantageous circumstances, while only one in five Black children and one in three Hispanic children are born into advantageous circumstances. This study further projected that 50% of all children born into disadvantaged circumstances versus more than 66% of those born into advantaged circumstances are on track toward healthy development and economic security at age 30. This disparity in reaching economic stability by 30 is further stratified by race, where 58% of white children from disadvantaged circumstances are on track but only 37% of Black, non-Hispanic and 50% of Hispanic children from similar circumstances meet this projection.[22] With structural economic and social stakeholders like residential segregation, unequal access to educational opportunities, and unequal treatment by law enforcement contributing to this ongoing disparity, the 2017–2018 season severely misrepresents reality.
Not even in our select sample of shows depicting low-income characters did we find representation of a low-income BIPOC family to help us exemplify the above finding. Thus, there is a void in scripted television for this arena of representation.

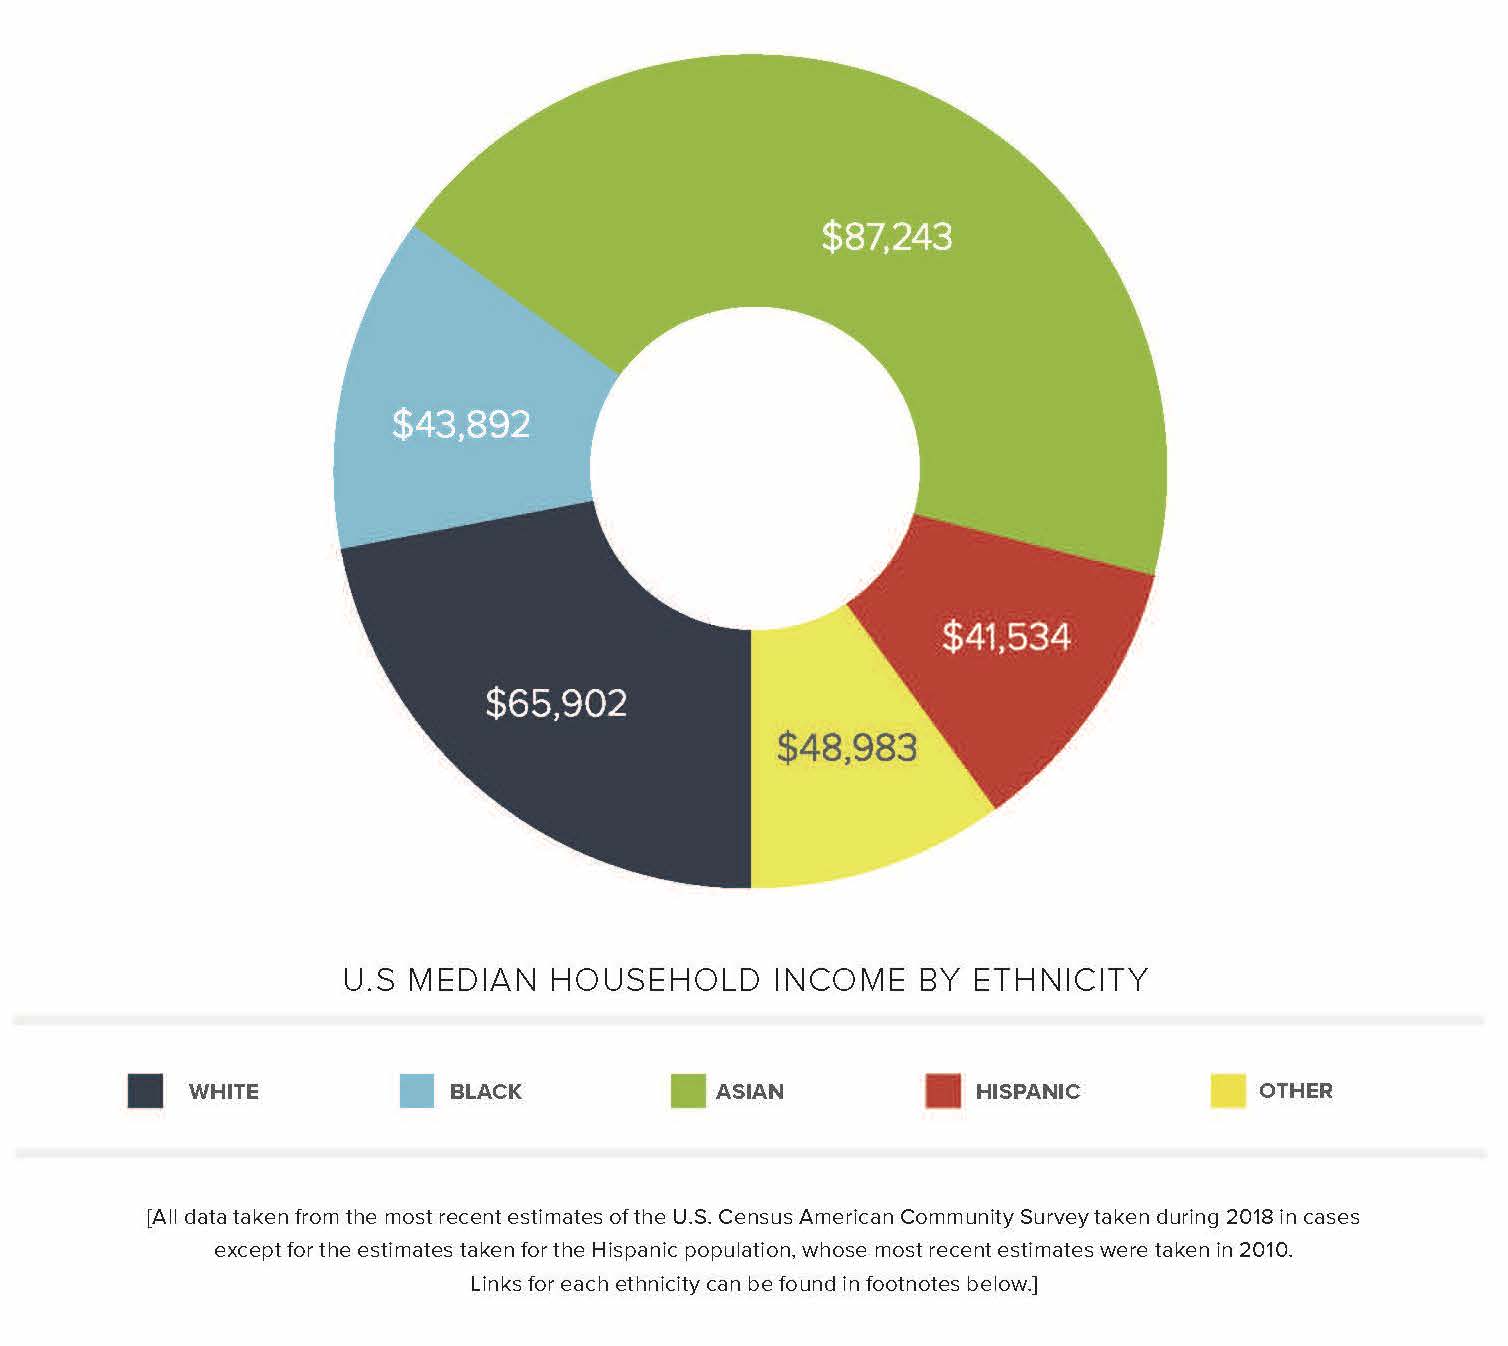
20 https://www.urban.org/research/publication/2021-poverty-projections
21 Asian, 2018: https://data.census.gov/cedsci/table?tid=ACSSPP1Y2018.S0201&hidePreview=true&t=012%20-%20Asian%20alone%20%28400-499%29%3A031%20-%20Asian%20 alone%20or%20in%20combination%20with%20one%20or%20more%20other%20races%20%20%28400-499%29%20%26%20%28100-299%29%20or%20%28300,%20A01-Z99%29%20 or%20%28400-999%29
Black, 2018: https://data.census.gov/cedsci/table?tid=ACSSPP1Y2018.S0201&hidePreview=true&t=004%20-%20Black%20or%20African%20American%20alone%3A005%20-%20 Black%20or%20African%20American%20alone%20or%20in%20combination%20with%20one%20or%20more%20other%20races
Hispanic, 2010: https://data.census.gov/cedsci/table?q=&t=400%20-%20Hispanic%20or%20Latino%20%28of%20any%20race%29%3AEarnings%20%28Individuals%29%3AIncome%20 %28Households,%20Families,%20Individuals%29%3AIncome%20and%20Earnings%3AIncome%20and%20Poverty%3ASNAP%2FFood%20Stamps&tid=ACSDP5YSPT2010.DP03
Other, 2018: https://data.census.gov/cedsci/table?tid=ACSSPP1Y2018.S0201&hidePreview=true&t=070%20-%20Some%20other%20race%20alone%3A071%20-%20Some%20other%20 race%20alone%20or%20in%20combination%20with%20one%20or%20more%20other%20races
White, 2018: https://data.census.gov/cedsci/table?tid=ACSSPP1Y2018.S0201&hidePreview=true&t=002%20-%20White%20alone%3A003%20-%20White%20alone%20or%20in%20combi-nation%20with%20one%20or%20more%20other%20races
22 https://www.urban.org/research/publication/identifying-pathways-upward-mobility
