Character Representation
FREQUENCY OF LOW-INCOME CHARACTER REPRESENTATION
With the median U.S. household income in 2017 being $62,626 and more than 50% of the U.S. population falling below or at this income, we hypothesized that a significant amount of television episodes would reflect this level of income distribution. However, in our analysis of more than 100 randomly selected TV episodes from the 2017–2018 season, we found that the lower brackets of income were underrepresented in favor of overrepresentation of middle to upper-middle income households.[9]
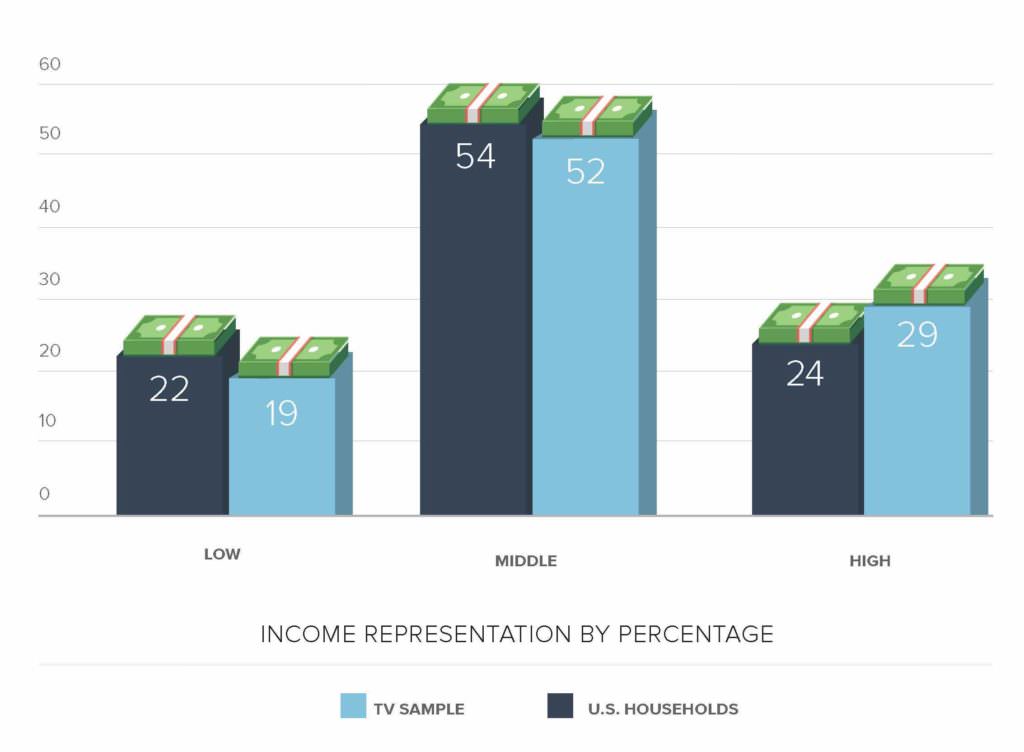
While there was an abundance of representation for middle-income individuals within our sample (indeed, most characters in this study represent this social stratum at 54%), we found that most of the characters from our sample fell on the higher side of the middle-class range, which includes those making incomes from $41K to $120K.[10]
Within the select sample of 35 episodes specifically centered on low- and lower-middle wage workers, characters held a range of low-paying job roles, including handyman, health inspector, mechanic, speech aide, bail bondsperson, server, and big box store associate. A not insignificant amount of the job roles captured had a pattern of being elevated in pay based on the minimum level of education required to fill the job role. However, investigator and detective pay, in particular, seemed to have no cumulative tie to higher education requirements and was the most consistent job role within the dataset to be ascribed a level of pay within the $100K+ pay range.

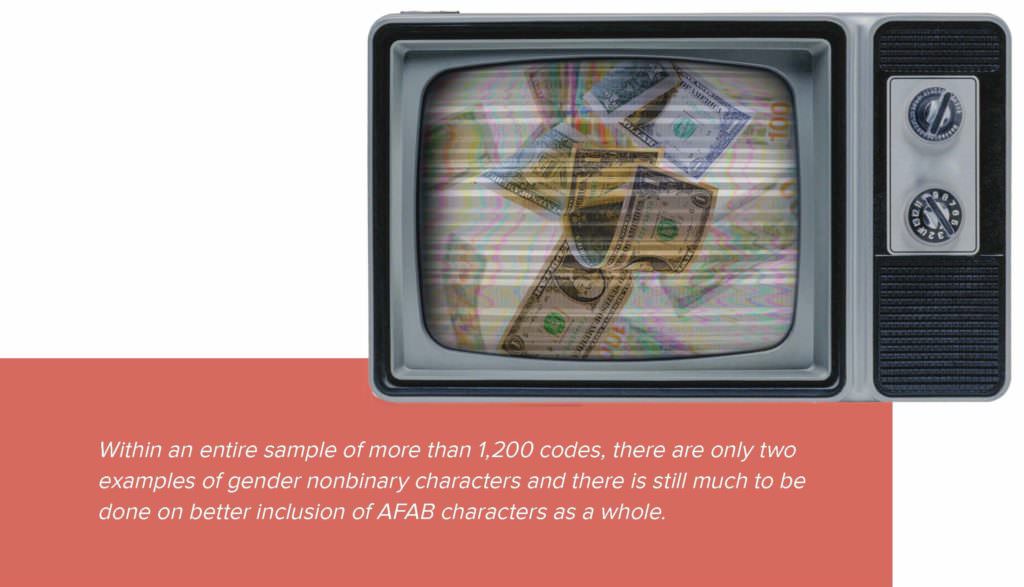
No significant disparity among income level was found within demographics. Actors with perceived male – Assigned Male at Birth (AMAB) – or female gender assignment at birth (AFAB)[12] had near equal representation within each income level. AFAB characters made up approximately 42% of the characters studied, whereas AMAB represent 54%.[13] With a ratio of 3:4 where for every three AFAB characters there are four AMAB characters, representation is relatively constant across the board. That is not to say that the ±6% of characters are not indicative for change in this area. Within an entire sample of more than 1,200 codes, there are only two examples of gender nonbinary characters and there is still much to be done on better inclusion of AFAB characters as a whole.
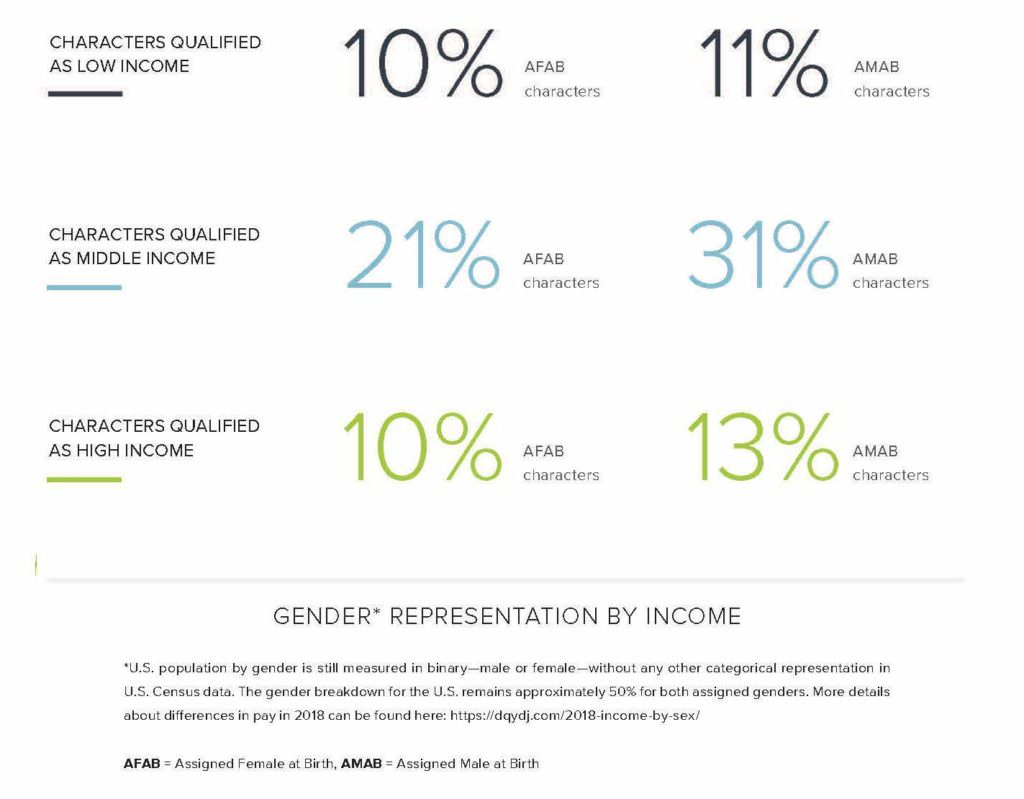
Relative to income representation, 10% of AFAB characters qualified as low income to AMAB’s 11%. Middle income has a greater difference in gender disparity, with AFAB characters yielding on 21% to AMAB characters 31%. Parity for high-income characters shows AFAB characters make up 10% of these characters, while AMAB characters represent 13% of those observed.
Similar relationships can be found in racial representation within the study, with the caveat that there was absolutely no representation of Indigenous American or Native characters within the episodes watched.[14] White characters make up the majority of character representation, consisting of 65% of characters in the study. Meanwhile, Asian (5%), Black (16%), Hispanic (6%), and Other (6%) occupy significantly less space within the shows sampled. For additional details about this dynamic and the level of representation within key vs. recurring roles, please see Breaking Down Portrayed Income.
9 Explore this in greater detail within, “Breaking Down Portrayed Income,” of this report.
10 Explore this in greater detail within, “Breaking Down Portrayed Income,” of this report.
11 Explore this in greater detail within, “Breaking Down Portrayed Income,” of this report.
12 These terms used to best encapsulate gender nonbinary individuals and those with undisclosed gender designation and reflect the ways genders exist beyond binary observation.
13 The 4% not accounted for here represent missing data within the dataset.
14 At least none of the characters identified themselves as such.
